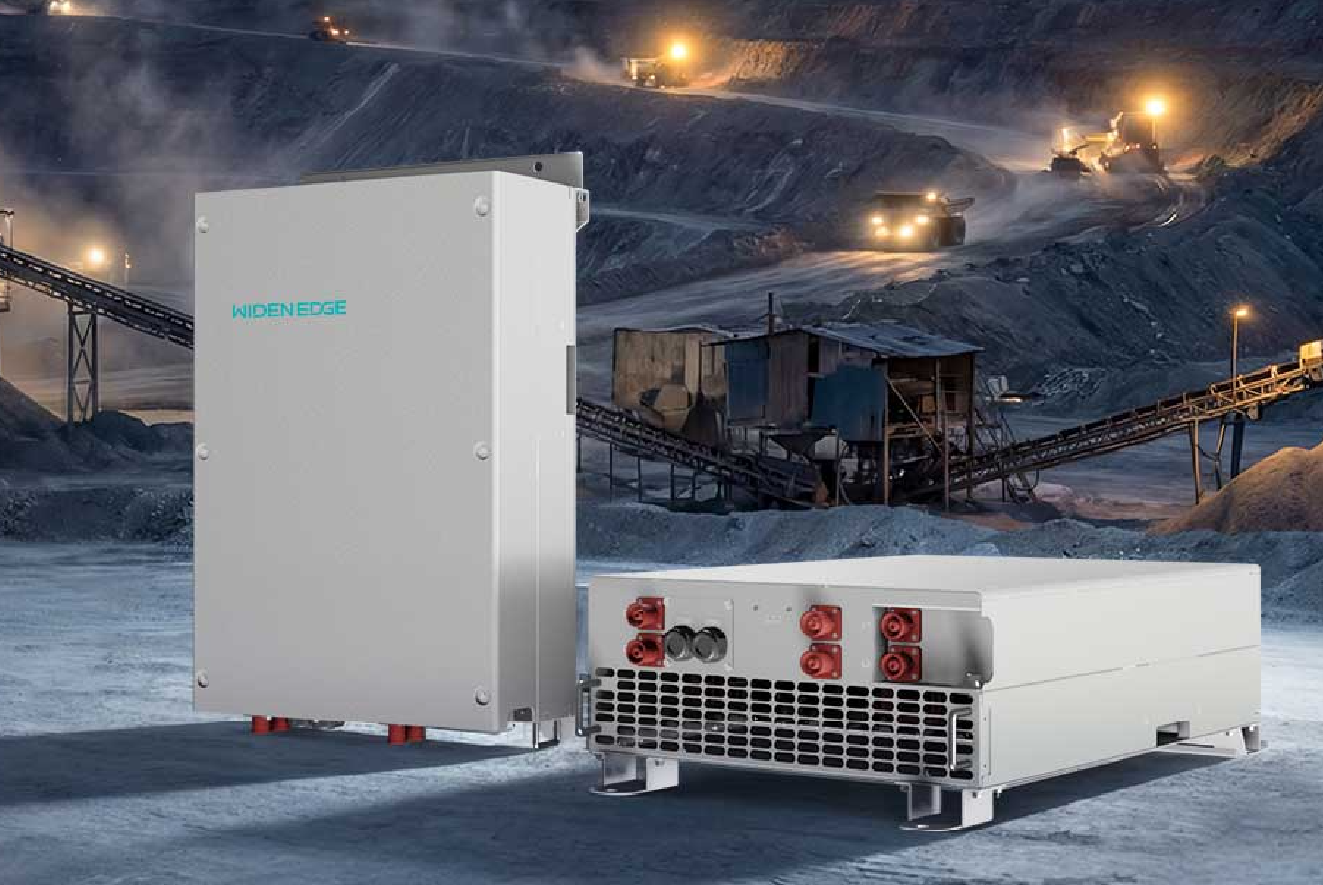
Opening: the problem that keeps project teams up at night
Projects promise steady backup, lower bills, and reliable ramping, but the field too often spits back a stack of questions instead of proof. That’s the problem I’m trying to fix here: how to run a case study on a 125 kW commercial storage inverter so the numbers mean something and stakeholders stop arguing over assumptions. Folks testing systems should know how a 45kW solar storage inverter pairs with a larger bank during real use, and why a site in California coping with wildfire-driven outages will frequently specify a 45 kW hybrid inverter as part of its resilience strategy. We’ll walk through the problem, the right measurements, and how to report without fluff.
Problem-driven logic: what’s broken in most case studies
Here’s the rub: many case studies are designed to prove a product, not to reveal performance. That shows up as:- Short test windows that miss seasonal derates.- Missing baseline comparisons to site metering before storage.- Numbers reported as percentages or averages without combing raw time-series data.- Ignoring thermal and grid-interaction effects during peak demand events.A study that wants to convince operators and financiers has to be honest about variability and limits. Y’all need tests that survive a real grid hiccup, not just a sunny day.
Core metrics you must measure and how to report them
Measure these, and do it clean:- Energy throughput (kWh delivered/charged) — report daily and monthly totals, show cumulative degradation trends.- Round-trip efficiency — derive from simultaneous charge/discharge cycles; show median and 90th percentile, not only mean.- State of charge (SoC) distribution over time — include histograms and time-series to show cycling depth.- Response time and ramp rate — capture milliseconds-to-seconds for control actions during grid events.- Thermal behavior at inverter and battery rack — log temps and note any derating points.- Islanding reliability and transfer time — document success/failure across multiple simulated outages.- Revenue-related metrics (demand charge reduction, energy arbitrage) — present both modeled and realized numbers with the inputs spelled out.When you report, include raw time-series CSVs, data validation logs, and a short methods appendix that lists sensors, sampling rates, and any filters applied.
Designing tests so results are defensible
Design with repeatability in mind:- Use a pre-install baseline period (30–90 days) to compare load profiles.- Run consecutive testing windows that capture different utility tariff schedules and at least one seasonal high-temperature period.- Include stress tests: full-rate discharge, high PV + storage export, and grid-loss islanding.- Keep a control strategy: compare at least two dispatch logics — one vendor default and one site-operator logic.- Sample fast for events (1s–1min) and aggregate for reporting (5–15min), keeping raw high-frequency logs archived.These choices ensure other engineers can reproduce your conclusions or find the edge cases fast.
Data collection and QA: avoid the common traps
Don’t let bad data wreck your case study:- Sync all clocks to a common NTP server before you start.- Validate sensor calibration and log that validation in the report.- Flag and explain gaps; never fill missing data without documenting the method used.- Keep versioned datasets so any post-hoc analysis can point back to the exact numbers used in claims.If you see sudden drops in throughput, check thermal derate and grid events first — those are the usual culprits.
Comparative findings and alternatives to consider
If you’re sizing a system near 125 kW, compare topologies instead of brands:- AC-coupled vs DC-coupled storage: note where PV clipping or backfeed risk changes economics.- Central inverter vs modular string inverters: compare failure modes and partial outages.- Hybrid inverter solutions around 45 kW are common building blocks for modular scaling.Run side-by-side scenarios with identical load traces and tariff inputs so the tradeoffs show up in both operational performance and maintenance exposure.
How to present results so decision-makers can act
Tell a clear story with clean deliverables:- Executive summary with headline metrics (peak shaving success rate, avoided outage minutes, monthly revenue impact).- Detailed annex with raw data, code snippets for analysis, and QA logs.- Visuals: stacked time-series for PV + storage + load, SoC heatmaps, and scatter plots of efficiency vs ambient temperature.- Risk section listing observed failures, workarounds, and recommended design changes.Numbers speak loudest when they come with provenance — where they came from, how they were processed, and who verified them.
Common mistakes and quick fixes
Watch for these mistakes:- Reporting only averages — fix by adding percentile and event-level stats.- Using modeled solar without measured irradiance — fix by co-locating a pyranometer.- Ignoring maintenance events in the timeline — fix by keeping an operations diary linked to the dataset.Follow those fixes and your study won’t get tossed during technical due diligence.
Final synthesis
If you approach a 125 kW commercial inverter case study the way a mechanic approaches a stubborn engine — with the right tools, a checklist, and the patience to chase the odd noise — you’ll produce numbers people can trust. That practical, no-nonsense style of documentation is the same kind of material teams tend to compare against supplier specs and project logs on WidenEdge, and it makes the decision clear when the grid tests get real.